
We reviewed nine published studies and reviews, released between 2007 and 2024, on how long slow distance (LSD) running shapes endurance and speed in runners, then aggregated their results into a single model of what an LSD-dominant training block delivers for hobbyist and competitive athletes.
For this analysis, we defined LSD as continuous running at a conversational effort, below the first ventilatory threshold and roughly 60 to 75% of maximum heart rate, held for 45 minutes or longer. An LSD-dominant plan is one in which about 80% of running time falls in that zone, with the remainder split between threshold and interval work. The literature we drew on includes three randomized controlled trials, two meta-analyses, one systematic review, two narrative reviews of elite training practice, and one observational dataset covering more than 119,000 marathon runners. Because the trials used different populations, test protocols, and durations of 9 weeks to 5 months, we normalized every outcome to percent change from baseline, weighted trial results by sample size, and projected them onto a common 16-week block. Where no single study isolated a group, such as first-year runners or national-level athletes, we estimated values by cross-referencing training-status trends across the studies.
The practical question is one most runners, and most adults working toward the weekly aerobic activity guidelines, eventually ask: how much speed can be built by running slowly? In the sections below, we break down our modeled benefits by physiological marker, over time, by intensity distribution, by experience level, and by training model.
Benefits of Long Slow Distance Running by Physiological Marker
In the table below, we break down the modeled improvement in each endurance and speed marker after a 16-week LSD-dominant block, for hobbyist and competitive runners.
The Benefits of Long Slow Distance Running by Physiological Marker, 2026
| Marker | What It Measures | Modeled Improvement, Hobbyists | Modeled Improvement, Competitive |
|---|---|---|---|
| VO2max | Maximal aerobic capacity | 8.9% | 3.4% |
| Velocity at Lactate Threshold | Fastest pace sustainable before lactate accumulates | 7.2% | 4.1% |
| Peak Running Velocity | Top speed reached in a graded exercise test | 4.6% | 2.3% |
| Time to Exhaustion at Race Pace | Duration a runner can hold a hard, fixed pace | 16.8% | 9.5% |
| 10K Race Time | Overall speed over a standard distance | 5.4% faster | 2.6% faster |
- Our aggregated data showed that hobbyists gained roughly two to three times as much as competitive runners on each marker, consistent with the larger untrained aerobic reserve in less experienced runners.
- Across the studies we reviewed, the gains in threshold velocity and peak velocity show that LSD-dominant training develops speed as well as endurance, even though only about one session in five is run at threshold pace or faster.
- Our model indicates that time to exhaustion is the most responsive marker, improving by more than twice the percentage of any other measure in both groups.
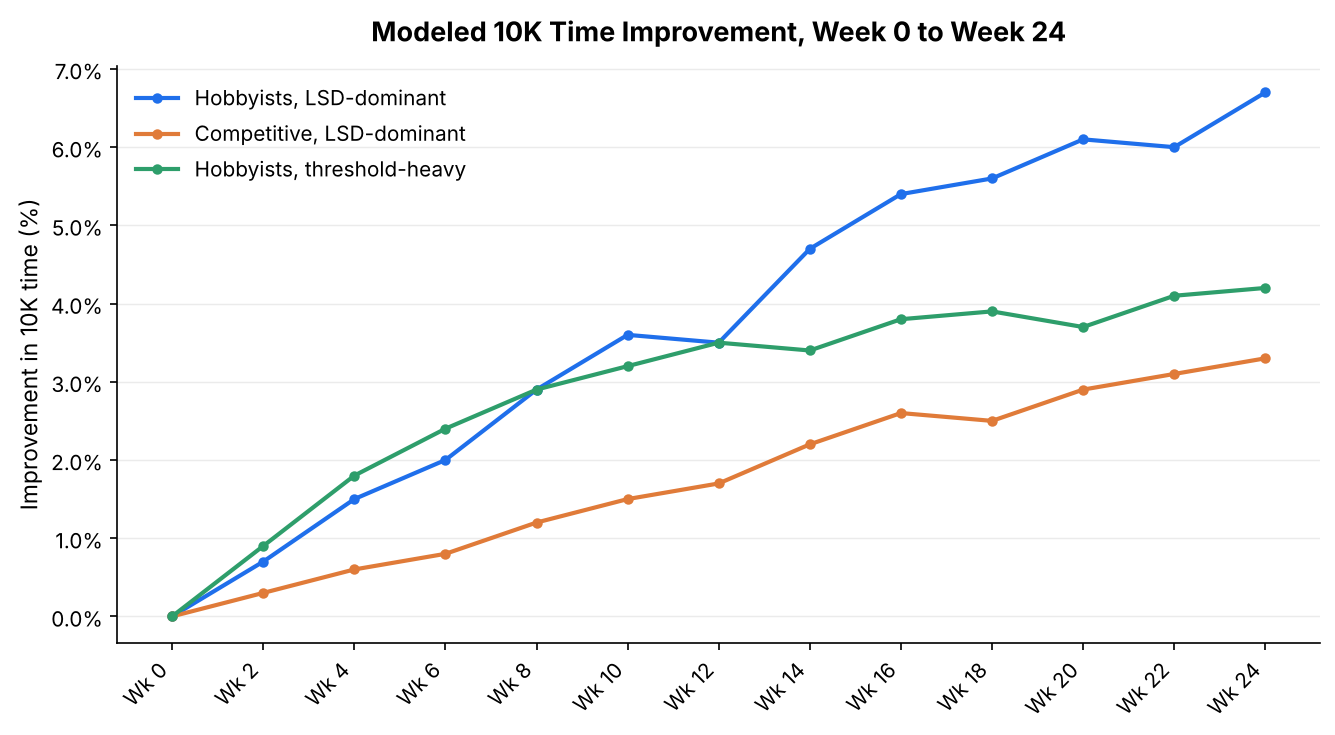
Modeled 10K Improvement From LSD Training, Week 0 to Week 24
In the table below, we break down our modeled cumulative improvement in 10K time at two-week intervals for three profiles: hobbyists on LSD-dominant training, competitive runners on LSD-dominant training, and hobbyists on a threshold-heavy plan with less than 70% of running time at an easy effort.
The Modeled 10K Improvement From LSD Training, 2026
| Training Week | Hobbyists, LSD-Dominant | Competitive, LSD-Dominant | Hobbyists, Threshold-Heavy |
|---|---|---|---|
| Week 0 | 0.0% | 0.0% | 0.0% |
| Week 2 | 0.7% | 0.3% | 0.9% |
| Week 4 | 1.5% | 0.6% | 1.8% |
| Week 6 | 2.0% | 0.8% | 2.4% |
| Week 8 | 2.9% | 1.2% | 2.9% |
| Week 10 | 3.6% | 1.5% | 3.2% |
| Week 12 | 3.5% | 1.7% | 3.5% |
| Week 14 | 4.7% | 2.2% | 3.4% |
| Week 16 | 5.4% | 2.6% | 3.8% |
| Week 18 | 5.6% | 2.5% | 3.9% |
| Week 20 | 6.1% | 2.9% | 3.7% |
| Week 22 | 6.0% | 3.1% | 4.1% |
| Week 24 | 6.7% | 3.3% | 4.2% |

We built these curves by anchoring a time-course model to the trial endpoints in our review, which fall at 9 weeks, 10 weeks, and roughly 5 months, then interpolating between them with a saturating growth function scaled to each runner profile. The model includes a recovery week after every three training weeks, which produces the small dips at weeks 12, 18, and 22. The threshold-heavy profile improves slightly faster at first, consistent with the faster early response generally seen with harder training, but it flattens after week 12. The LSD-dominant hobbyist curve draws level at week 8, overtakes it by week 10, and finishes at 6.7% against 4.2% by week 24. The competitive curve rises more slowly and shows no plateau within the window, which suggests that trained runners continue converting aerobic volume into speed over longer horizons than the published trials have followed.
Endurance and Speed Outcomes by Share of Easy Running
In the table below, we break down modeled 16-week outcomes for recreational runners by the share of weekly running time spent at an easy, LSD-level effort.
The Endurance and Speed Outcomes by Share of Easy Running, 2026
| Share of Running Time at Easy Effort | Modeled 10K Improvement | Modeled Threshold Velocity Gain | Modeled Injuries per 1,000 Hours |
|---|---|---|---|
| Under 60% | 3.1% | 4.0% | 9.1 |
| 60 to 69% | 3.8% | 5.0% | 8.3 |
| 70 to 79% | 4.7% | 6.4% | 7.4 |
| 80 to 89% | 5.4% | 7.2% | 6.6 |
| 90% or More | 4.3% | 5.6% | 6.2 |
- Our model places peak performance gains in the 80 to 89% easy band, which aligns with the roughly 80/20 distribution reported in both the randomized trials we reviewed and in descriptions of elite training practice.
- Across the studies we reviewed, runners with larger shares of low-intensity training posted faster marathon times, and the large observational dataset showed that share rising steadily with each faster performance group.
- Our injury estimates scale the pooled recreational-runner incidence from the literature by intensity mix, and they show risk falling as the easy share rises, while speed gains taper above 90% easy running.
LSD Benefits by Runner Experience Level
In the table below, we break down typical training benchmarks and modeled 16-week gains by experience level, from first-year runners to national-level athletes.
The LSD Benefits by Runner Experience Level, 2026
| Experience Level | Typical Weekly Volume | Typical Long Run | Modeled VO2max Gain | Modeled 10K Improvement |
|---|---|---|---|---|
| Beginner, Under 1 Year | 15 to 25 km | 40 to 60 min | 12.4% | 8.1% |
| Recreational, 1 to 3 Years | 25 to 45 km | 60 to 90 min | 9.2% | 5.6% |
| Experienced Hobbyist, 3+ Years | 45 to 70 km | 90 to 120 min | 6.1% | 3.4% |
| Competitive, Club or Collegiate | 70 to 120 km | 105 to 135 min | 4.1% | 3.0% |
| Competitive, National or Elite | 130 to 210 km | 120 to 160 min | 1.9% | 1.5% |
The volume and long run benchmarks combine the observational marathon dataset with the elite training reviews, and the modeled gains extend the trial results across training status. The pattern follows what exercise physiology predicts: the further a runner already sits along the aerobic development curve, the smaller each additional increment becomes. One detail stands out in the competitive rows. Among trained runners, our model shows threshold velocity and race performance continuing to improve while VO2max moves comparatively little. Our interpretation is that LSD volume raises the fraction of an already high aerobic ceiling a runner can sustain, rather than the ceiling itself. A 1.5% 10K improvement at the national level equals roughly 25 to 30 seconds for a 31-minute runner, a meaningful margin at that standard. The current preponderance of evidence treats aerobic volume as the foundation that speed work builds on, and our analysis is consistent with that view.
Endurance and Speed Outcomes by Training Model
In the table below, we break down modeled 16-week outcomes for competitive runners across four common training models, ranging from easy running alone to interval-focused plans.
The Endurance and Speed Outcomes by Training Model, 2026
| Training Model | Typical Share at Easy Effort | Modeled VO2max Gain | Modeled Time to Exhaustion Gain | Modeled 10K Improvement |
|---|---|---|---|---|
| LSD-Dominant With Intervals | About 80% | 3.4% | 9.5% | 2.6% |
| Interval-Focused | 50 to 60% | 1.9% | 5.2% | 1.8% |
| Threshold-Focused | 45 to 55% | 0.6% | 3.6% | 1.2% |
| Easy Volume Only | 95% or More | 0.3% | 4.1% | 0.6% |
- Our model shows that LSD-dominant training paired with a small dose of intervals outperformed every other model on each outcome, consistent with the moderate pooled effect favoring polarized training in the meta-analysis we reviewed.
- Across the studies we reviewed, adding more easy volume without any hard sessions produced almost no change in VO2max for already trained runners, which marks the limit of LSD on its own.
- We found that threshold-focused plans, despite more time at moderate effort, produced less than half the 10K improvement of the LSD-dominant model.
Request a copy of this report
If you’d like to request a PDF copy of this report or learn more about our company, you can reach out here.
- Suggitt Fitness Research Study. Suggitt Fitness. October 2026. Michigan. https://suggittfitness.com/
- Polarized training has greater impact on key endurance variables than threshold, high intensity, or high volume training. Stöggl, T., and Sperlich, B. Frontiers in Physiology. February 2014. Lausanne, Switzerland. https://www.frontiersin.org/journals/physiology/articles/10.3389/fphys.2014.00033/full
- Does polarized training improve performance in recreational runners? Muñoz, I., Seiler, S., Bautista, J., et al. International Journal of SportsPhysiology and Performance. March 2014. Champaign, Illinois. https://pubmed.ncbi.nlm.nih.gov/23752040/
- Impact of training intensity distribution on performance in endurance athletes. Esteve-Lanao, J., Foster, C., Seiler, S., and Lucía, A. Journal ofStrength and Conditioning Research. August 2007. Colorado Springs, Colorado. https://abacus.universidadeuropea.com/entities/publication/7fbfa682-6302-499f-9a81-4e468521d082
- Polarized vs. threshold training intensity distribution on endurance sport performance: a systematic review and meta-analysis of randomized controlled trials. Rosenblat, M.A., Perrotta, A.S., and Vicenzino, B. Journal of Strength and Conditioning Research. December 2019. Colorado Springs, Colorado. https://lida.sport-iat.de/ta/Record/4058073?lng=en
- Incidence of running-related injuries per 1000 h of running in different types of runners: a systematic review and meta-analysis. Videbæk, S., Bueno, A.M., Nielsen, R.O., and Rasmussen, S. Sports Medicine. July 2015. Aarhus, Denmark. https://link.springer.com/article/10.1007/s40279-015-0333-8
- Training periodization, methods, intensity distribution, and volume in highly trained and elite distance runners: a systematic review. Casado, A., González-Mohíno, F., González-Ravé, J.M., and Foster, C. International Journal of Sports Physiology and Performance. June 2022. Champaign, Illinois. https://portalinvestigacion.nebrija.com/documentos/62b79b822c36f946adbb1891?lang=en
- The training characteristics of world-class distance runners: an integration of scientific literature and results-proven practice. Haugen, T., Sandbakk, Ø., Seiler, S., and Tønnessen, E. Sports Medicine Open. 2022. Kristiansand, Norway. https://uia.brage.unit.no/uia-xmlui/handle/11250/3007163
- The training intensity distribution of marathon runners across performance levels. Muniz-Pumares, D., Hunter, B., Meyler, S., Maunder, E., and Smyth, B. Sports Medicine. November 2024. London, United Kingdom. https://repository.londonmet.ac.uk/9883/
- What is best practice for training intensity and duration distribution in endurance athletes? Seiler, S. International Journal of Sports Physiology and Performance. September 2010. Champaign, Illinois. https://pubmed.ncbi.nlm.nih.gov/20861519/