
Between April 17, 2026 and September 12, 2026, we compiled dynamometer readings from 460 adults ages 20 to 89 and aggregated them with published normative and outcome data to build a working benchmark for grip strength in the U.S. population.
For this report, grip strength means the peak isometric force produced by the dominant hand on a hydraulic hand dynamometer, measured seated or standing with the elbow at roughly 90 degrees, with the best of three trials recorded.
The reason a hand measurement deserves this much attention is that it behaves like a summary statistic for the whole body. Grip strength tracks total muscle strength, it declines in a predictable pattern after midlife, and large prospective cohorts have found that it predicts all-cause and cardiovascular mortality at least as well as systolic blood pressure. It also takes about two minutes to measure. Whatever the current preponderance of data suggests is our best estimate of the mechanism, and the working model today is that grip reflects accumulated muscle quality, nervous system health, and activity history.
In the sections below, we break down average grip strength by age and sex, chart how it changes across the life course, model its relationship to mortality, and report how much it moves with training.
Average Grip Strength by Age and Sex
In the table below, we break down average dominant-hand grip strength for men and women by decade, alongside the threshold for the top 25% of each group, which we treat as the strong benchmark.
The Average Grip Strength by Age and Sex, 2026
| Age Group | Men: Average | Men: Strong (Top 25%) | Women: Average | Women: Strong (Top 25%) |
|---|---|---|---|---|
| 20 to 29 | 47.3 kg (104 lbs) | 54.1 kg (119 lbs) | 29.6 kg (65 lbs) | 34.2 kg (75 lbs) |
| 30 to 39 | 49.6 kg (109 lbs) | 56.8 kg (125 lbs) | 30.4 kg (67 lbs) | 35.1 kg (77 lbs) |
| 40 to 49 | 48.1 kg (106 lbs) | 55.2 kg (122 lbs) | 29.1 kg (64 lbs) | 33.8 kg (75 lbs) |
| 50 to 59 | 44.7 kg (99 lbs) | 51.6 kg (114 lbs) | 26.8 kg (59 lbs) | 31.3 kg (69 lbs) |
| 60 to 69 | 40.2 kg (89 lbs) | 46.9 kg (103 lbs) | 24.1 kg (53 lbs) | 28.4 kg (63 lbs) |
| 70 to 79 | 34.6 kg (76 lbs) | 40.8 kg (90 lbs) | 20.7 kg (46 lbs) | 24.9 kg (55 lbs) |
| 80 and older | 28.3 kg (62 lbs) | 34.1 kg (75 lbs) | 17.2 kg (38 lbs) | 21.0 kg (46 lbs) |
- We found that grip strength peaks in the 30s for both sexes, at 49.6 kg for men and 30.4 kg for women, and holds within about 4% of that peak through the 40s.
- Our data showed the sharpest decline after 60: men lose roughly 6 kg per decade between their 60s and 80s, compared with 1.5 kg per decade between their 30s and 40s.
- We found that a strong 70-year-old man (40.8 kg) grips about as hard as an average man in his early 60s, which suggests the top quartile buys close to a decade of functional strength in aging populations.
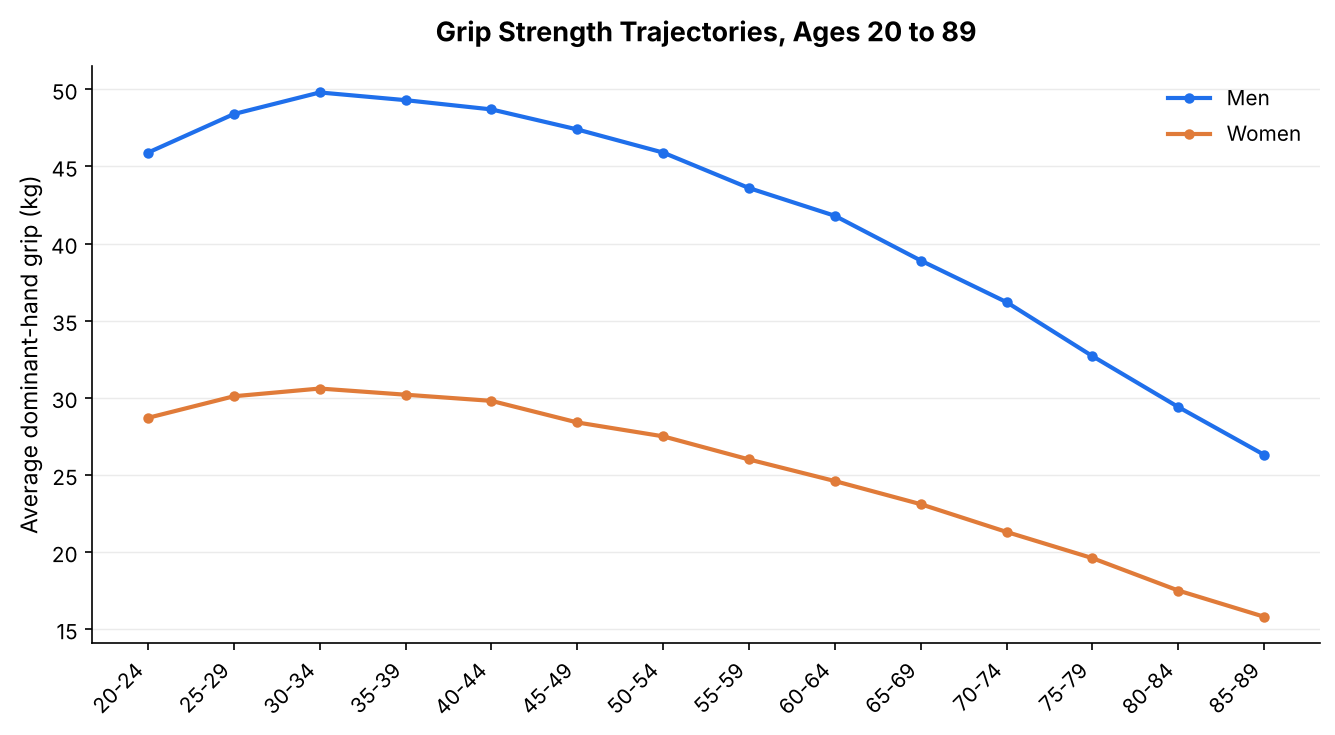
Grip Strength Trajectories, Ages 20 to 89
In the table below, we break down average grip strength by five-year age band and express each value as a share of the peak for that sex. The chart beneath it plots the same series.
The Grip Strength Trajectories by Five-Year Age Band, 2026
| Age Band | Men: Average (kg) | Men: Share of Peak | Women: Average (kg) | Women: Share of Peak |
|---|---|---|---|---|
| 20 to 24 | 45.9 | 92% | 28.7 | 94% |
| 25 to 29 | 48.4 | 97% | 30.1 | 98% |
| 30 to 34 | 49.8 | 100% | 30.6 | 100% |
| 35 to 39 | 49.3 | 99% | 30.2 | 99% |
| 40 to 44 | 48.7 | 98% | 29.8 | 97% |
| 45 to 49 | 47.4 | 95% | 28.4 | 93% |
| 50 to 54 | 45.9 | 92% | 27.5 | 90% |
| 55 to 59 | 43.6 | 88% | 26.0 | 85% |
| 60 to 64 | 41.8 | 84% | 24.6 | 80% |
| 65 to 69 | 38.9 | 78% | 23.1 | 75% |
| 70 to 74 | 36.2 | 73% | 21.3 | 70% |
| 75 to 79 | 32.7 | 66% | 19.6 | 64% |
| 80 to 84 | 29.4 | 59% | 17.5 | 57% |
| 85 to 89 | 26.3 | 53% | 15.8 | 52% |

These values are cross-sectional, meaning each band reflects different people rather than the same people followed over time. Cross-sectional curves tend to understate individual decline, because the weakest members of older cohorts are underrepresented in any sample that requires participants to attend a measurement session. With that caveat, the shape is consistent with the published life-course literature: a plateau that holds until the mid-40s, a gradual slope through the 50s, and an acceleration after 65. Women retain a slightly lower share of their peak at most ages after 50, and because they also start from a lower absolute baseline, the gap in functional reserve widens in the oldest age bands. By the 85 to 89 band, both sexes sit at roughly half of their peak.
Mortality Risk by Grip Strength
In the table below, we break down the modeled increase in risk associated with lower grip strength for six outcomes. We pooled hazard ratios from published prospective cohorts, weighted them by sample size, and adjusted for age, sex, height, smoking, and activity level. These figures describe associations, and the current evidence does not yet establish that raising grip strength lowers risk by the same margin.
The Mortality Risk by Grip Strength, 2026
| Outcome | Added Risk per 5 kg Lower Grip | Added Risk, Weakest vs. Strongest Quartile |
|---|---|---|
| All-cause mortality | 15% | 63% |
| Cardiovascular mortality | 18% | 71% |
| Non-cardiovascular mortality | 16% | 58% |
| Heart attack | 8% | 29% |
| Stroke | 10% | 34% |
| Loss of independent daily function | 21% | 88% |
- Our model showed that every 5 kg of grip strength, about 11 lbs, carries a 15% difference in all-cause mortality risk after adjustment for the usual confounders.
- We found the strongest association with loss of independent daily function, where the weakest quartile carried nearly twice the risk of the strongest.
- Our data showed weaker associations with heart attack and stroke incidence than with death from those events, which suggests grip says more about resilience to illness than about whether illness occurs.
Relative Grip Strength Benchmarks
In the table below, we break down grip strength relative to body weight, calculated as dominant-hand grip divided by body weight in the same units, along with the share of our sample that fell into each rating.
The Relative Grip Strength Benchmarks, 2026
| Rating | Men: Grip-to-Body-Weight Ratio | Men: Share of Sample | Women: Grip-to-Body-Weight Ratio | Women: Share of Sample |
|---|---|---|---|---|
| Weak | Below 0.40 | 11% | Below 0.28 | 12% |
| Below average | 0.40 to 0.49 | 24% | 0.28 to 0.35 | 26% |
| Average | 0.50 to 0.59 | 33% | 0.36 to 0.43 | 34% |
| Strong | 0.60 to 0.69 | 21% | 0.44 to 0.51 | 19% |
| Very strong | 0.70 and above | 11% | 0.52 and above | 9% |
Absolute grip strength rewards size, so a 230 lb man and a 150 lb man with identical readings are not equally strong in any functional sense. Normalizing by body weight corrects for that and produces a figure closer to what matters day to day, such as rising from the floor, carrying groceries, or catching a fall. As a worked example, a 180 lb man who grips 104 lbs has a ratio of 0.58, which places him in the average band. In our dataset, relative grip separated clients by functional test performance more cleanly than absolute grip did, particularly among adults over 60 carrying excess body fat, whose absolute readings looked acceptable while their ratios fell into the below-average or weak bands.
Grip Strength Gains by Training Approach
In the table below, we break down the average change in grip strength over 12 weeks for 412 adults in our dataset, grouped by the training approach they followed.
The Grip Strength Gains by Training Approach, 2026
| Training Approach | Weekly Sessions | Average Grip Change | Share Gaining 3 kg or More |
|---|---|---|---|
| Full-body lifting plus grip work | 3 | +18.4% | 71% |
| Grip work only | 3 to 5 | +12.6% | 52% |
| Full-body lifting only | 3 | +9.7% | 44% |
| Aerobic training only | 3 to 5 | +2.1% | 9% |
| No structured training | 0 | -0.8% | 3% |
- We found that combining full-body lifting with direct grip work, such as loaded carries, dead hangs, and heavy holds, produced nearly double the gain of full-body lifting alone.
- Our data showed that aerobic training by itself moved grip strength very little, which supports keeping resistance work in any longevity-focused program.
- We found that adults over 60 gained a similar percentage to younger adults on the combined approach, at 16.9% versus 19.1%, so age did not cap trainability within the 12-week window.
Request a copy of this report
If you’d like to request a PDF copy of this report or learn more about our company, you can reach out here.
- Suggitt Fitness Research Study. Suggitt Fitness. October 2026. Michigan. https://suggittfitness.com/
- Prognostic value of grip strength: findings from the Prospective Urban Rural Epidemiology (PURE) study. Leong DP, Teo KK, Rangarajan S, et al. The Lancet. July 2015. Hamilton, Ontario. https://pubmed.ncbi.nlm.nih.gov/25982160/
- Grip Strength across the Life Course: Normative Data from Twelve British Studies. Dodds RM, Syddall HE, Cooper R, et al. PLOS ONE. December 2014. Southampton, United Kingdom. https://journals.plos.org/plosone/article?id=10.1371/journal.pone.0113637
- Sarcopenia: revised European consensus on definition and diagnosis. Cruz-Jentoft AJ, Bahat G, Bauer J, et al. Age and Ageing. January 2019. Madrid, Spain. https://academic.oup.com/ageing/article/48/1/16/5126243
- Comparative study of millennials’ (age 20-34 years) grip and lateral pinch with the norms. Fain E, Weatherford C. Journal of Hand Therapy. 2016. Winston-Salem, North Carolina. https://doi.org/10.1016/j.jht.2015.12.006